I decided to write about my maternal grandfather and the church he helped found in 1919, Plymouth Congregational Church. Please click on the images to enlarge them and read the articles below.
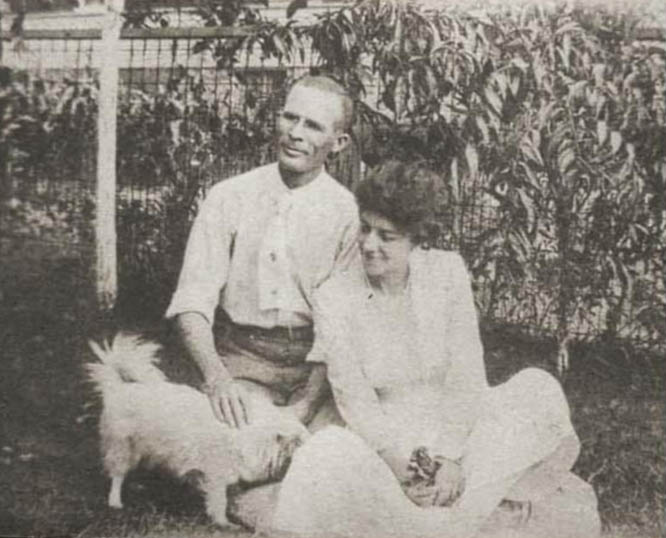
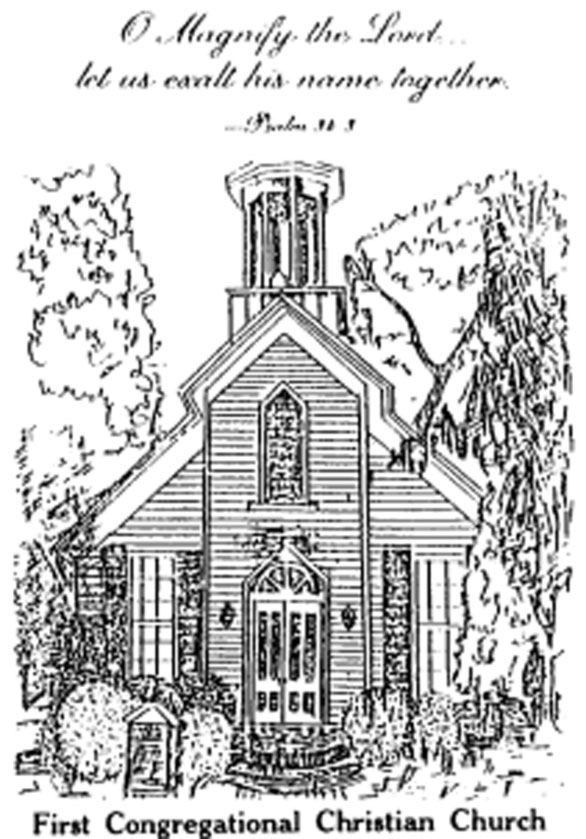
My grandparents, Mershell and Fannie (Turner) Graham met in the First Congregational Christian Church in Montgomery, Alabama. They were married there by Rev. Scott on June 14, 1919. After the ceremony, Mershell took his new bride back to Detroit to begin their new life. One thing that would be familiar was the worship service at the newly formed Plymouth Congregational Church.
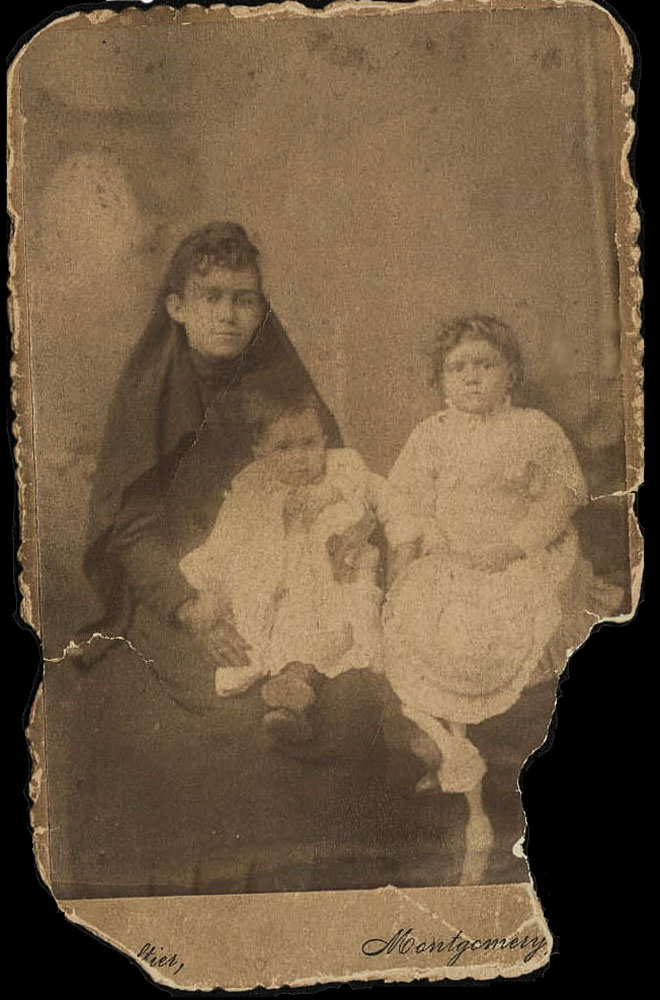
Fannie and Mershell soon after their marriage in 1919.
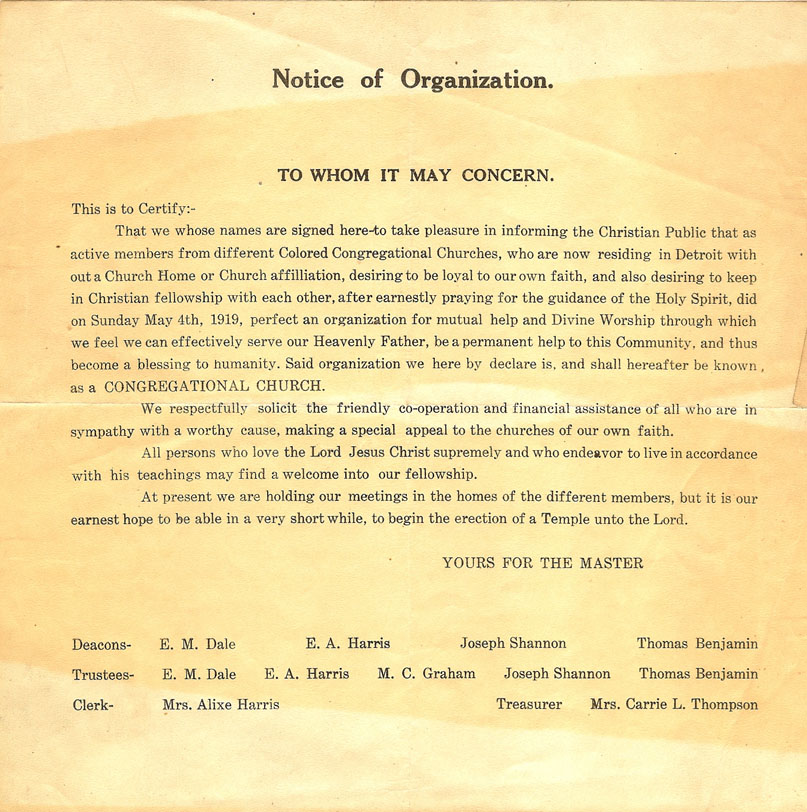
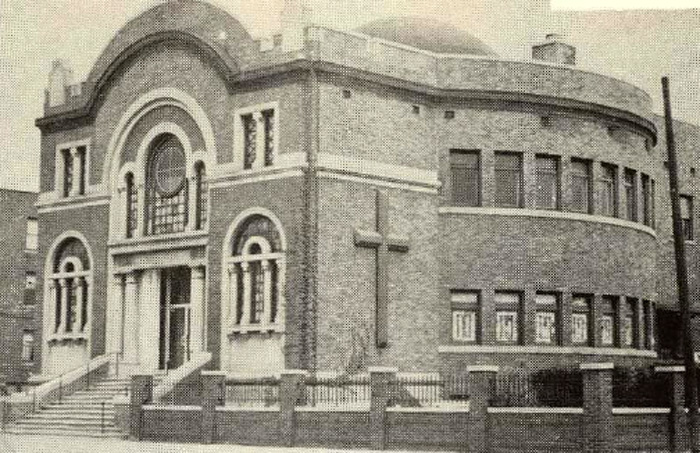
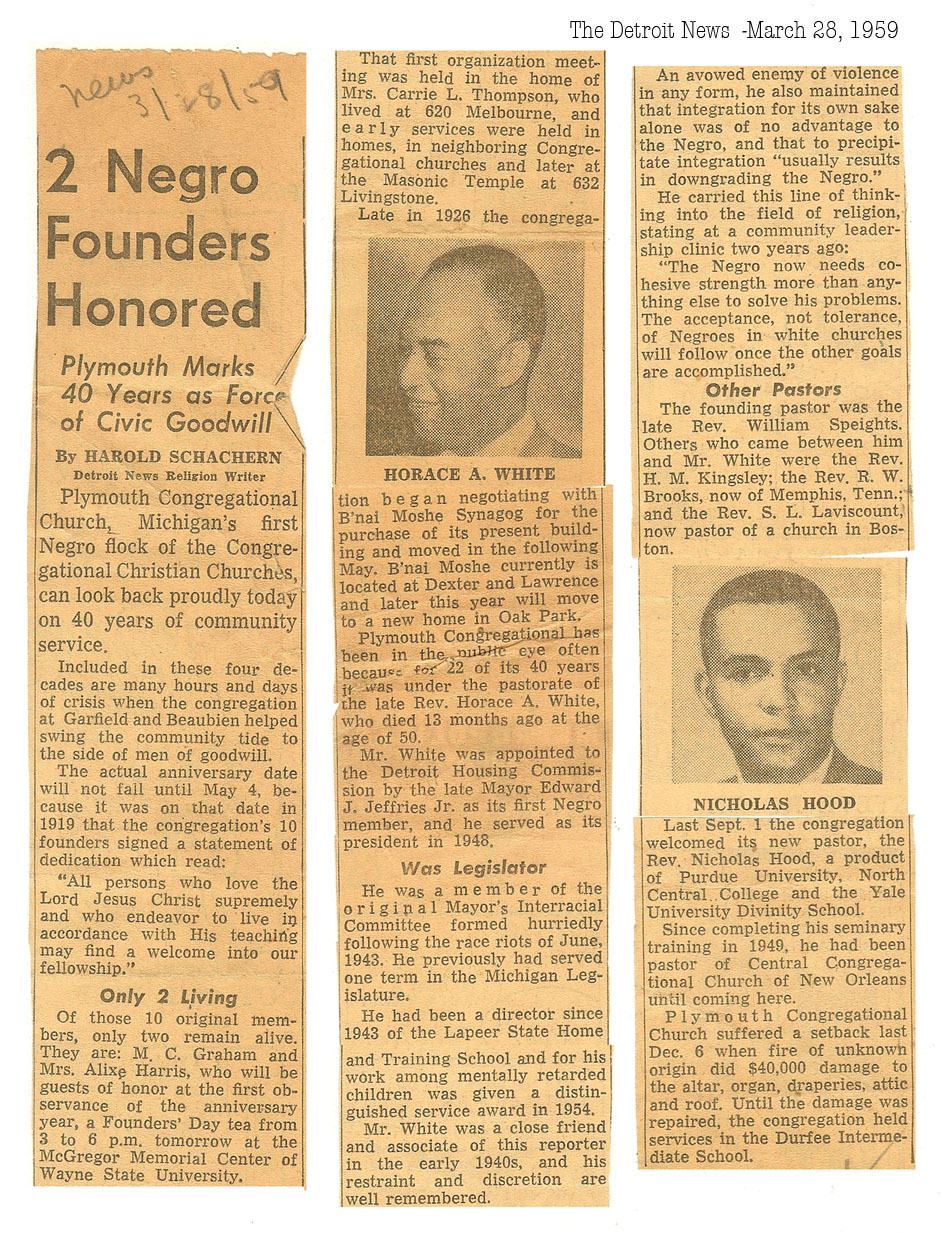
When Mershell, migrated to Detroit from Montgomery, AL in 1917, many of his friends, were also leaving. In 1919, nine of them gathered together to form Plymouth Congregational Church. At first they met in members homes and in borrowed and rented spaces. In 1927 they were able to purchase their own building, a former Synagogue. They moved in May 15, 1927.
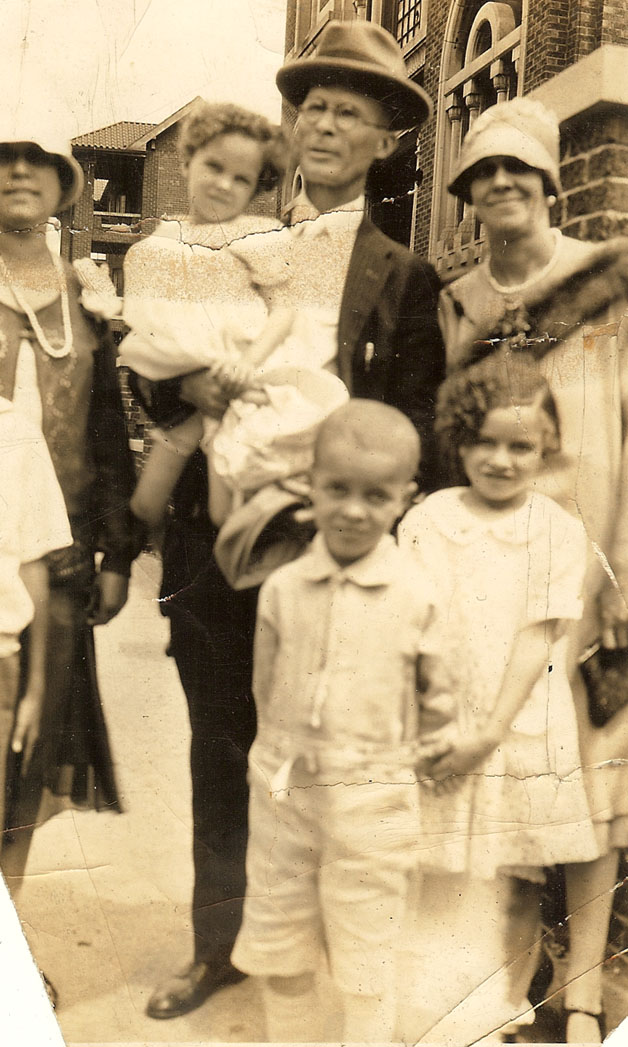
Plymouth Congregational Church at the corner of Garfield and Beaubien streets on the East Side of Detroit.After church about 1927. Mershell holding my mother Doris, Fannie standing behind Mary V. and Mershell Jr. in front.
Plymouth Congregational Church – September 30, 1928. Detroit, Michigan
Plymouth had been in the building about 1 year when this photo was taken. My grandfather, Mershell C. Graham, is standing behind his daughters, Mary V. and Doris (my mother). Their cousin, Margaret McCall, is standing between them. They are in the front row, towards the left side of center. The minister, Rev. Laviscount, is standing behind Mary V. My grandmother, Fannie, had just given birth to their youngest son, Howard, so she was not able to be there.
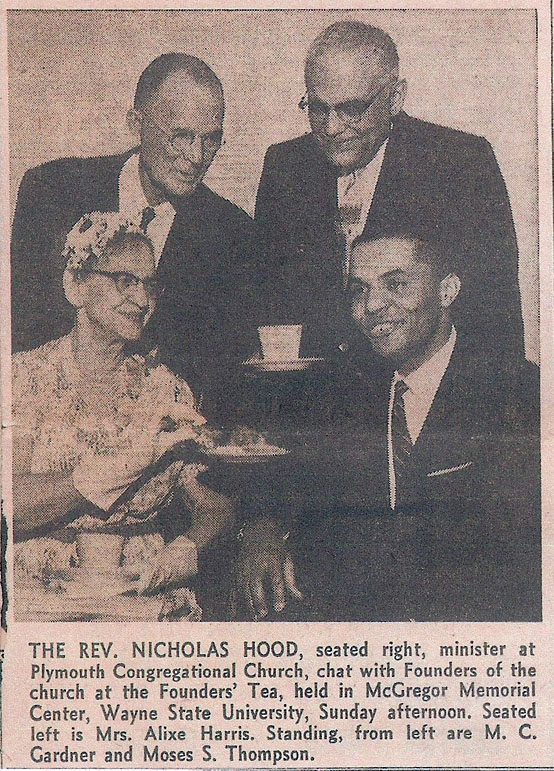
An article with some of the history of Plymouth Congregational Church.Mershell Graham’s name was misspelled as “Gardner” above.
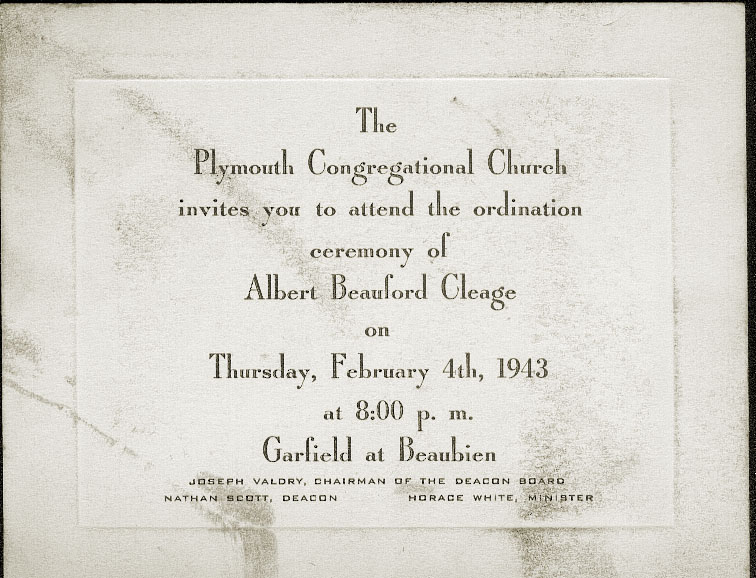
My parents met at Plymouth’s youth group. My father was ordained there. In November of 1943, my parents were married at Plymouth by Rev. Horace White. On a visit home to Detroit while we were living in Springfield, MA, I was Baptized there, also by Rev. Horace White.
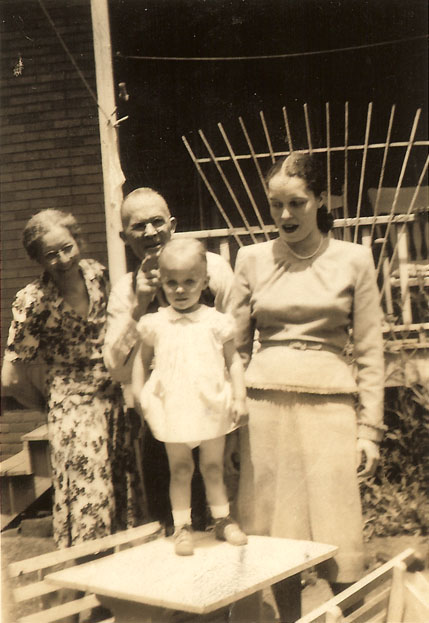
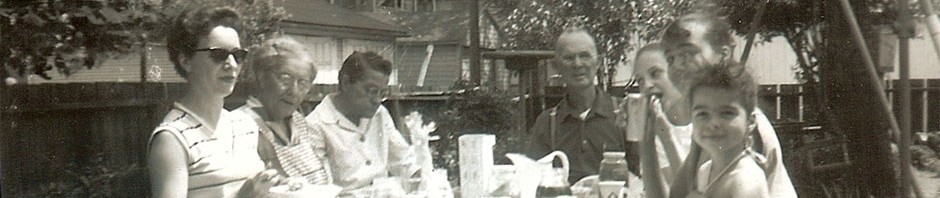
Invitation to my father’s Ordination.My grandmother Fannie, my grandfather Mershell and my mother Doris. I am standing on the table. I believe it was during this visit that I was Baptized at Plymouth.
Because I attended my father’s church on Sunday’s, I don’t have many memories of sitting in the pews at Plymouth. My memories are of going with my grandfather to fix thing, usually the furnace. My sister and my cousins and I would roam around the empty church while we waited for him to make the repairs.
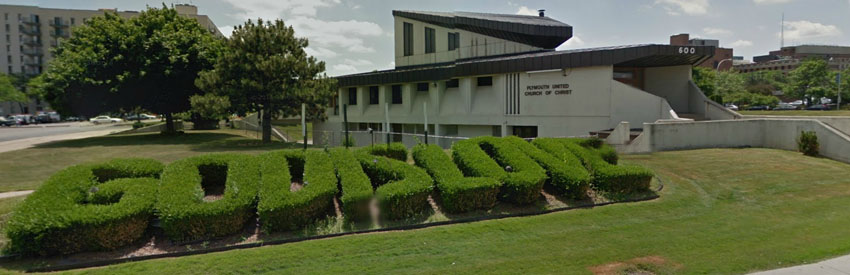
Plymouth Congregational Church, now Plymouth United Church of Christ, was forced to relocate when the area was urban renewed in order to build the Medical Center in the 1970s. White churches were allowed to remain in the area while black churches were forced to relocate. The new church is located at 600 E. Warren Ave. and continues in use by Plymouth today.
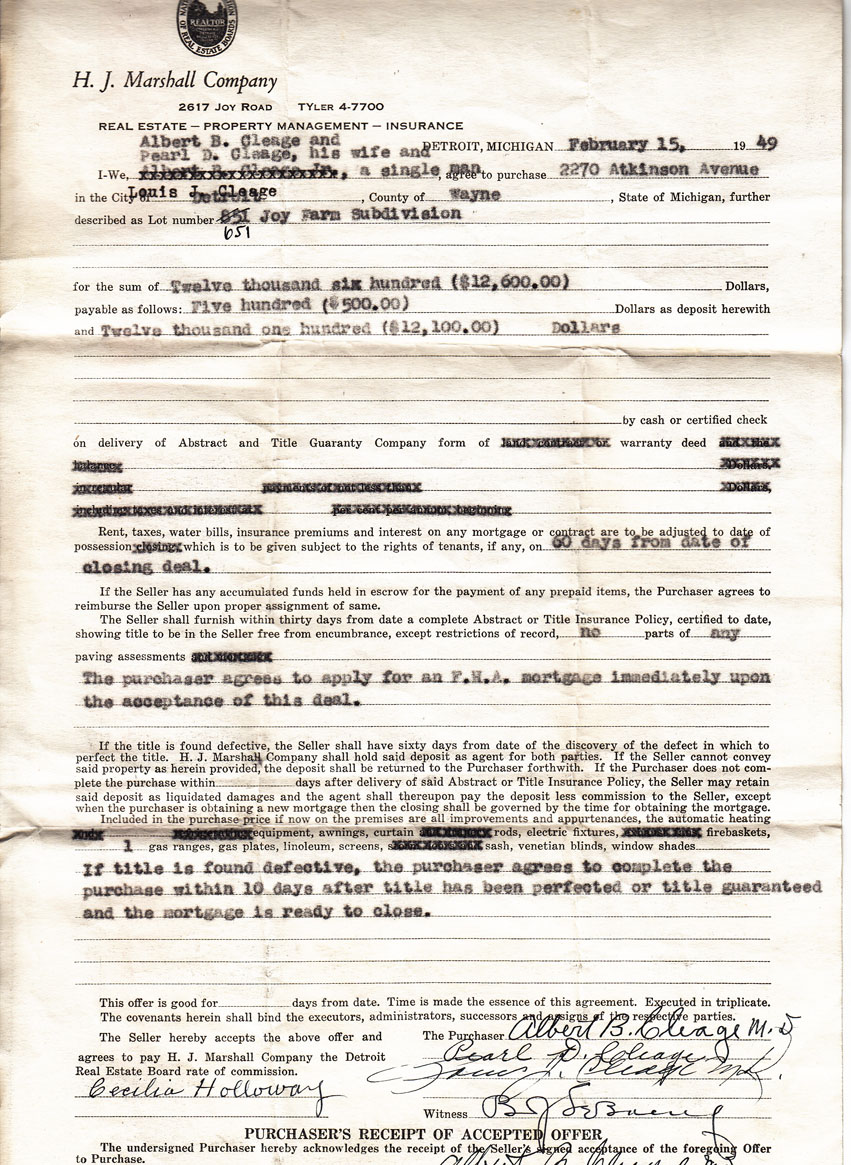
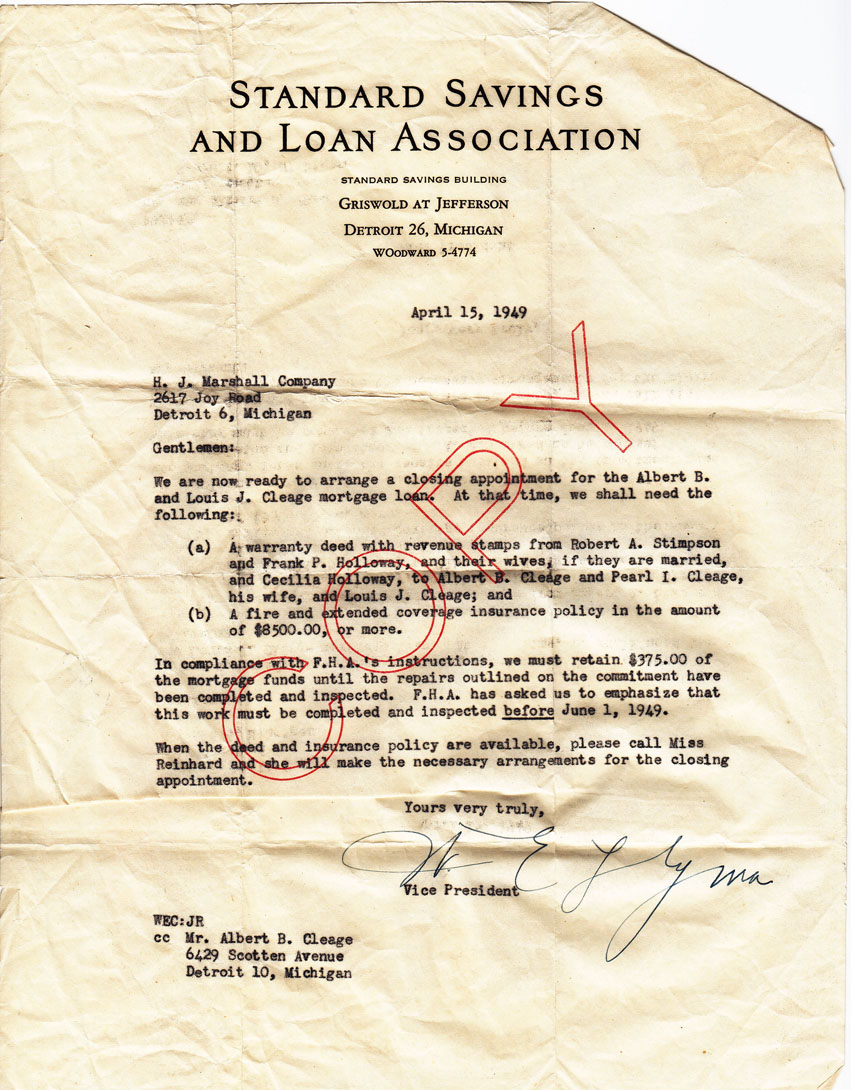
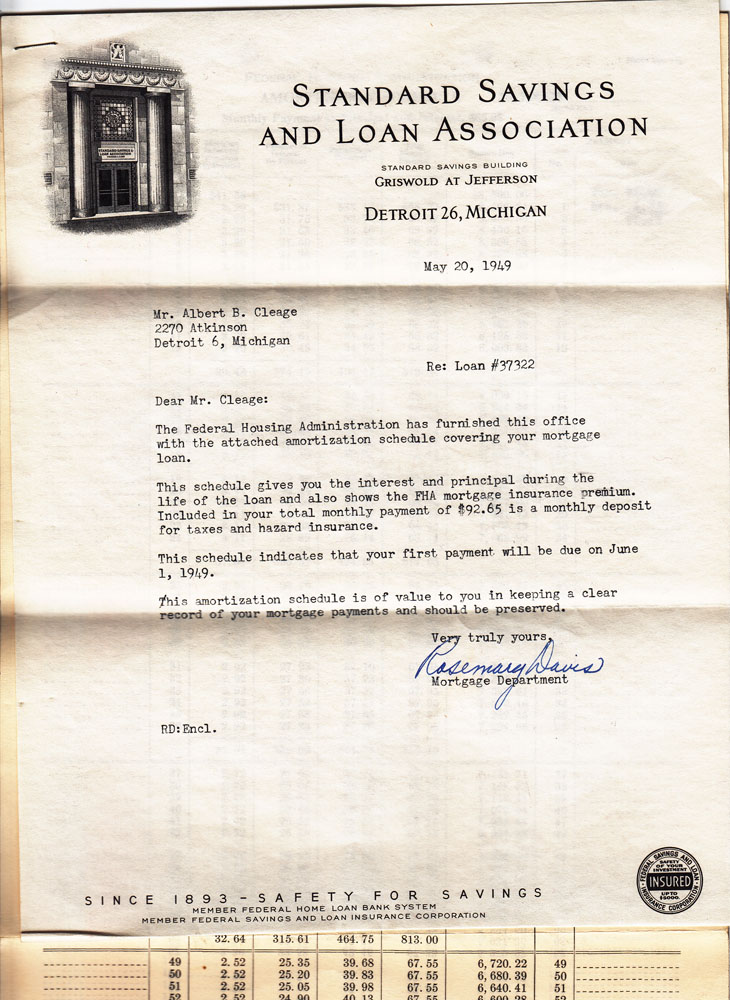
Recently I posted about my Cleage grandparent’s household in 1950. I wondered what they had paid for the house when they bought it the year before. Information sent to me by my ever helpful cousin Jan shows that the price was $12,600.
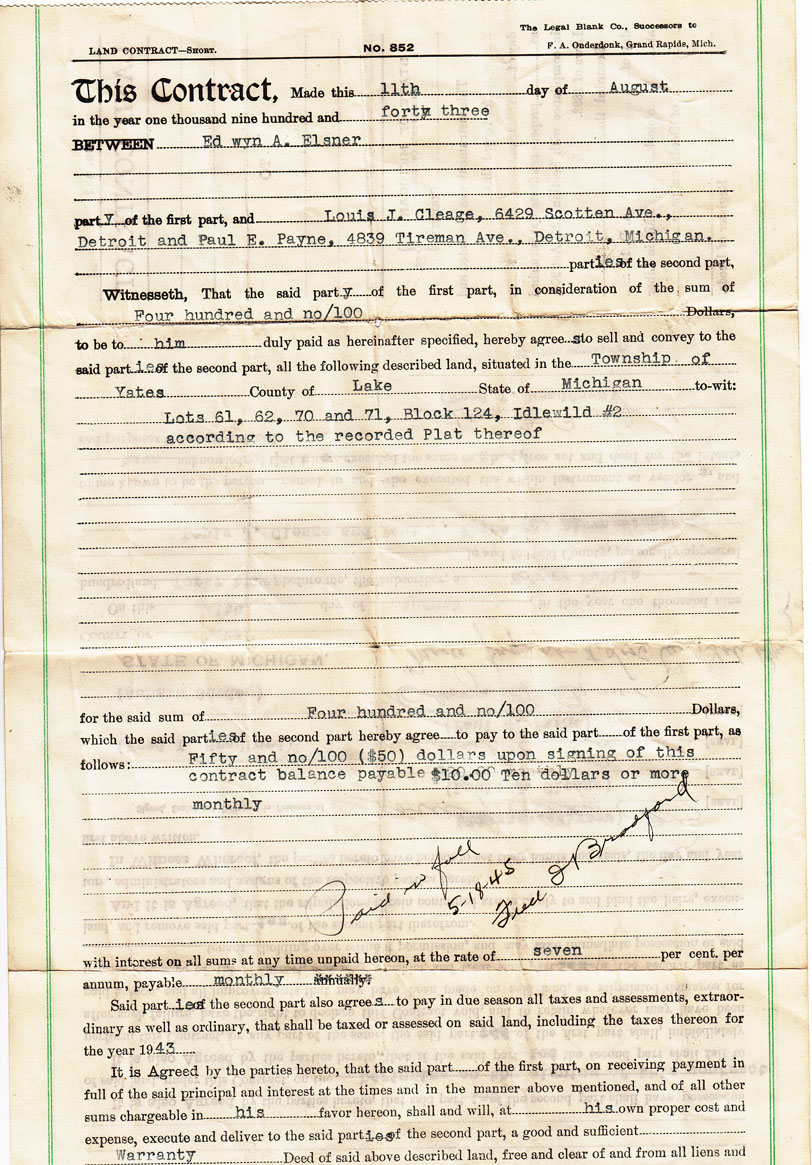
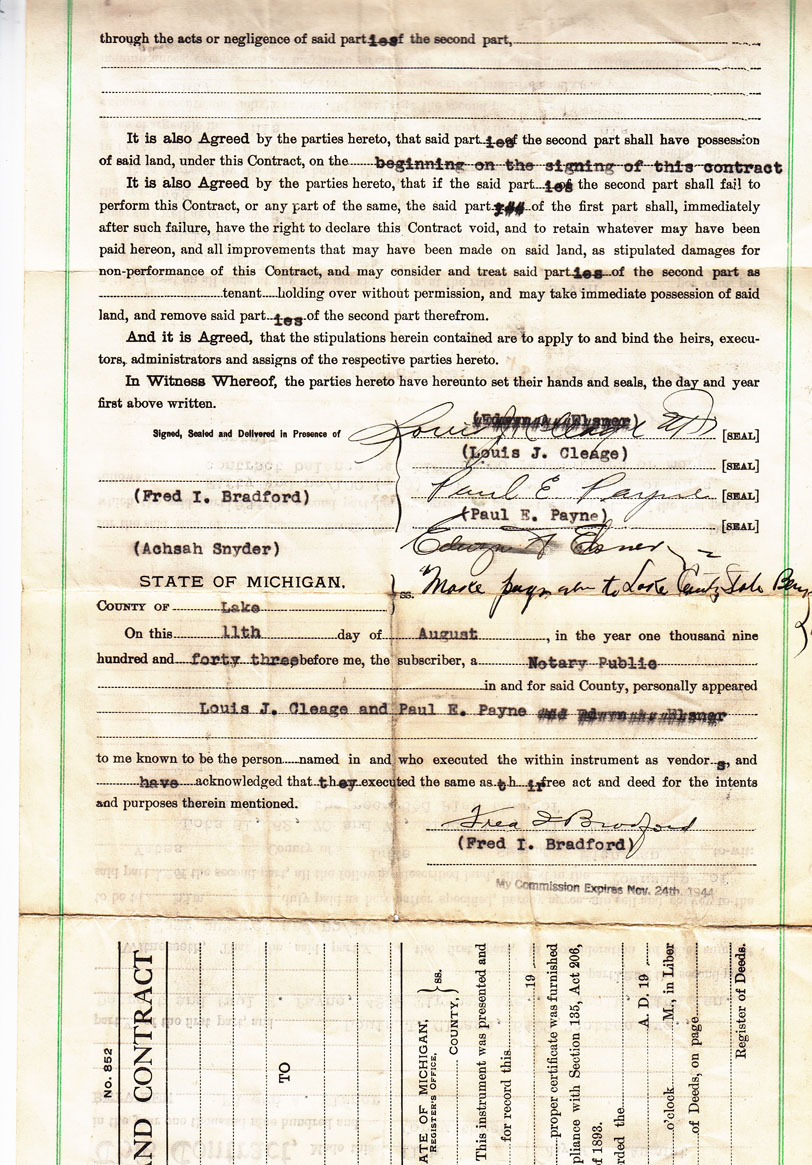
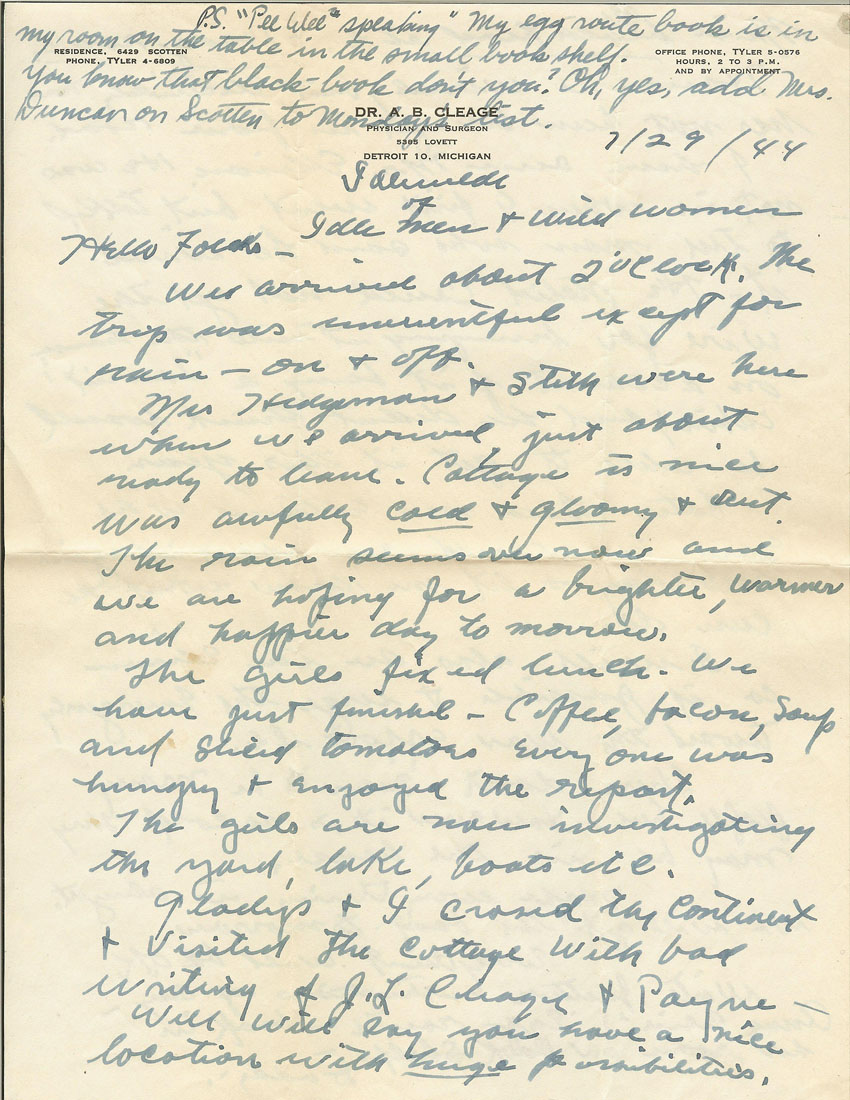
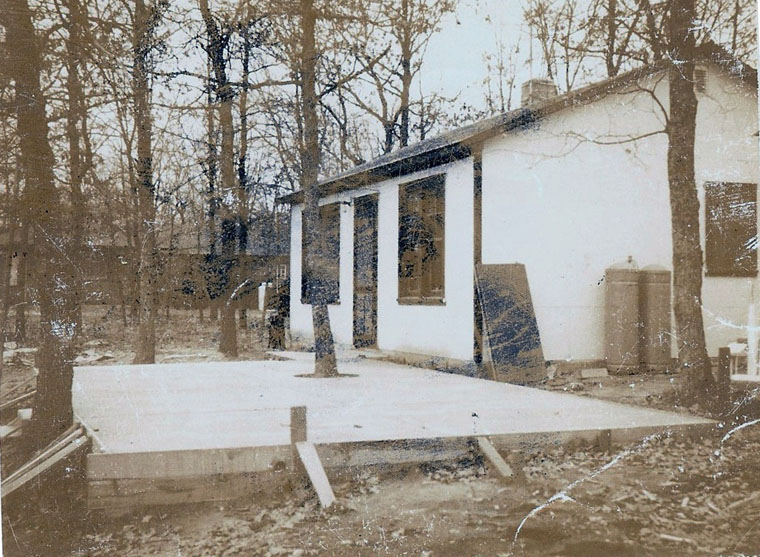
In 1943 my Uncle Louis Cleage and family friend, Paul Payne bought some lots in Idlewild, Michigan. Idlewild is a black resort located in the Manistee National Forest in Lake County. It’s 5 hours north of Chicago and 4 hours northwest of Detroit. Lake Michigan is half an hour away at Ludington. I’ve posted some photographs, documents and letters showing the progress of the original cottages. They did much of the work themselves. If you find the letter my grandfather wrote back to Detroit hard to read, scroll down to the transcription below.
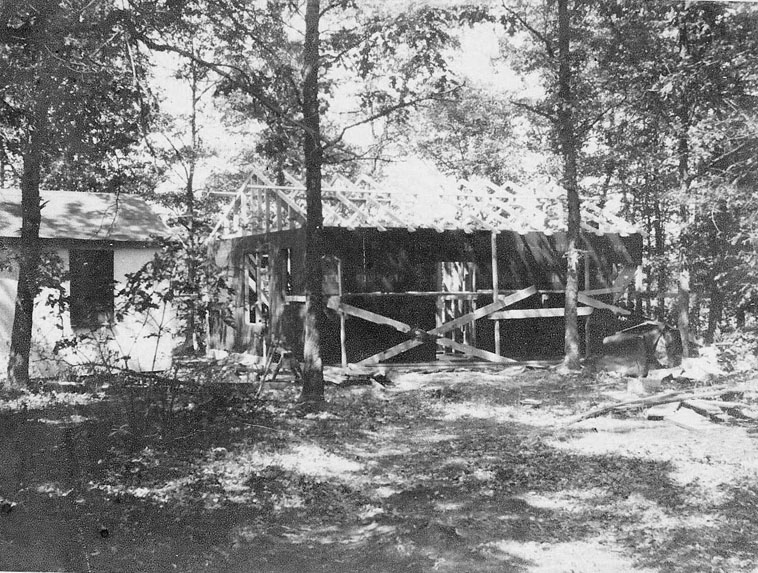
Original cottage under construction.
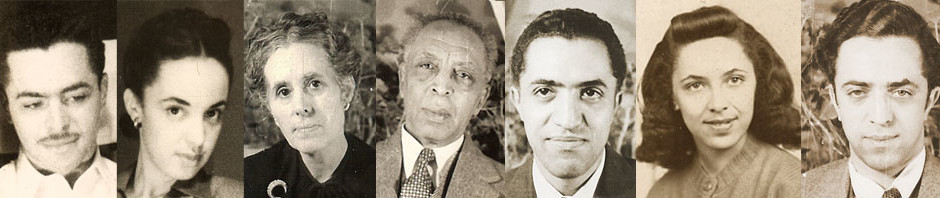
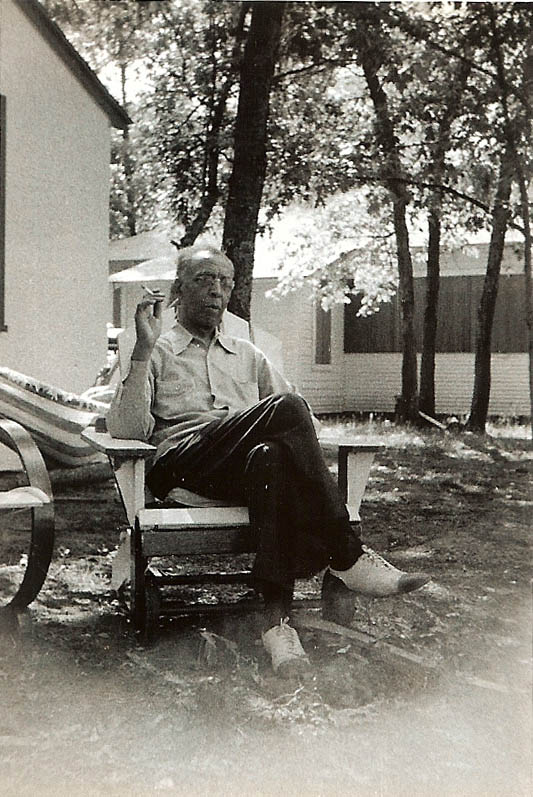
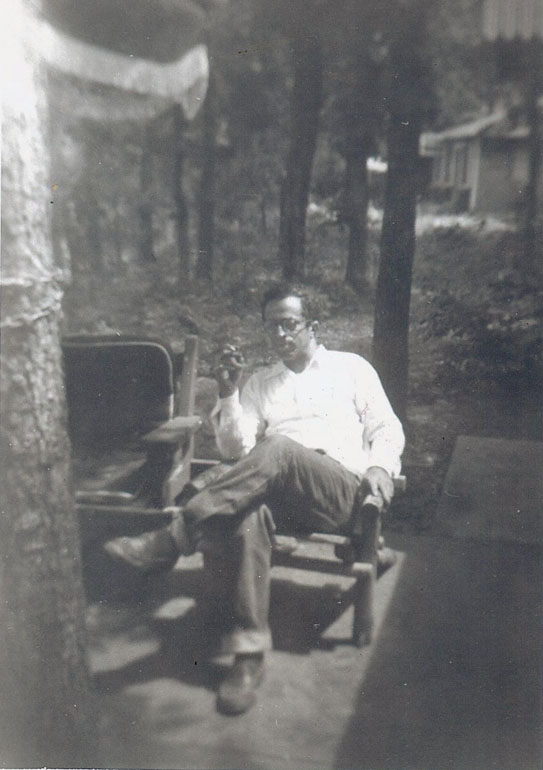
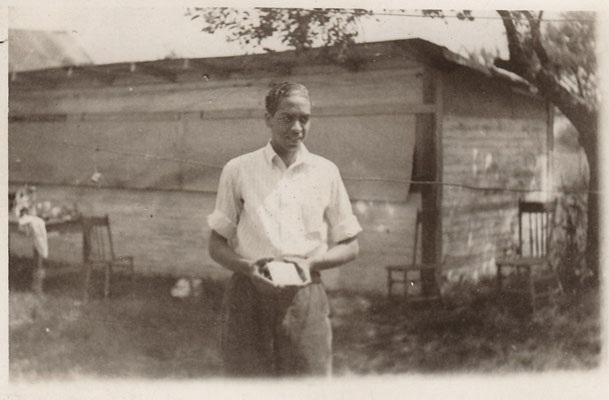
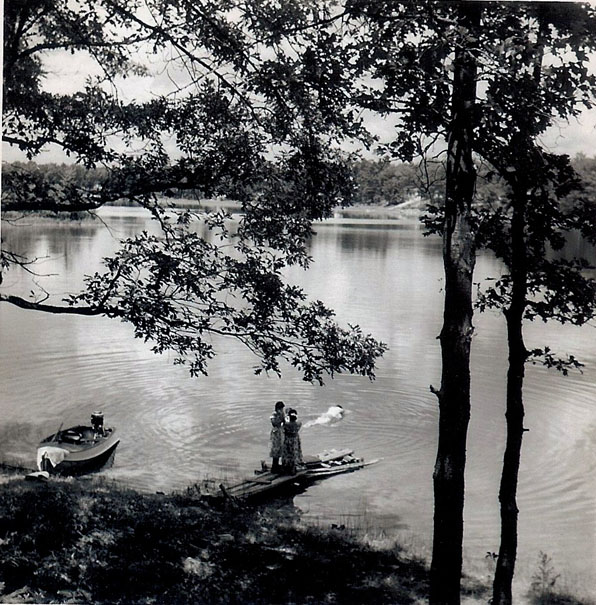
Dr. Albert B. Cleage, my grandfather.Louis Cleage on the patio.Paul Payne in Idlewild.On the dock looking at Lake Idlewild.
During WW 2, two of my uncle’s were conscientious objectors and farmed near Avoka, MI. They had milk cows and chickens, among other things. Their younger sister sold the eggs in Detroit around the neighborhood. While she was up in Idlewild, she needed someone at home – her mother – to handle the egg route. Like a paper route, but with eggs. Read more here.
P.S. “Pee Wee” speaking. My egg route book is in my room on the table in the small bookshelf. You know that black book, don’t you? Oh, yes, add Mrs. Duncan on Scotten to Monday’s list.
7/29/1944 Idlewild of Idle men and wild women.
Dear Folks –
We arrived about 2 o’clock. The trip was uneventful except for rain – on and off. Mrs. Hedgeman and Stith were here when we arrive just about ready to leave. Cottage is nice, was awfully cold and gloomy out. The rain seems over now and we are hoping for a brighter, warmer and happier day tomorrow.
The girls are now investigating the yard, lake, boats, etc. Gladys and I crossed the continent and visited the cottage with bad writing of J.L. Cleage and Payne – well, will say you have a nice location with huge possibilities. Nice beachhead etc, and hedgerows.
House is wired, but electricity has not been brought in from road. I have seen Mr. Ellison. He was not in when I first went but talked to the man who was and he wired it. He stated could not get the wire for bringing it into the house on account of it being a “tourist” cabin; and he didn’t think would be able to get it this year.
Later saw Mr. Ellison who said he would see about it again Monday and let me know what he can do. I will also see the Edison Co. if possible and urge the emergency toward the war effort etc.
There don’t seem to be many people here. However it is so cold they maybe in the house. Hope everything is alright. We will get the boat tomorrow. Everything will be ok. Write further instructions, if any – Anna Celia’s egg route book in her room on bookshelf –
Daddy
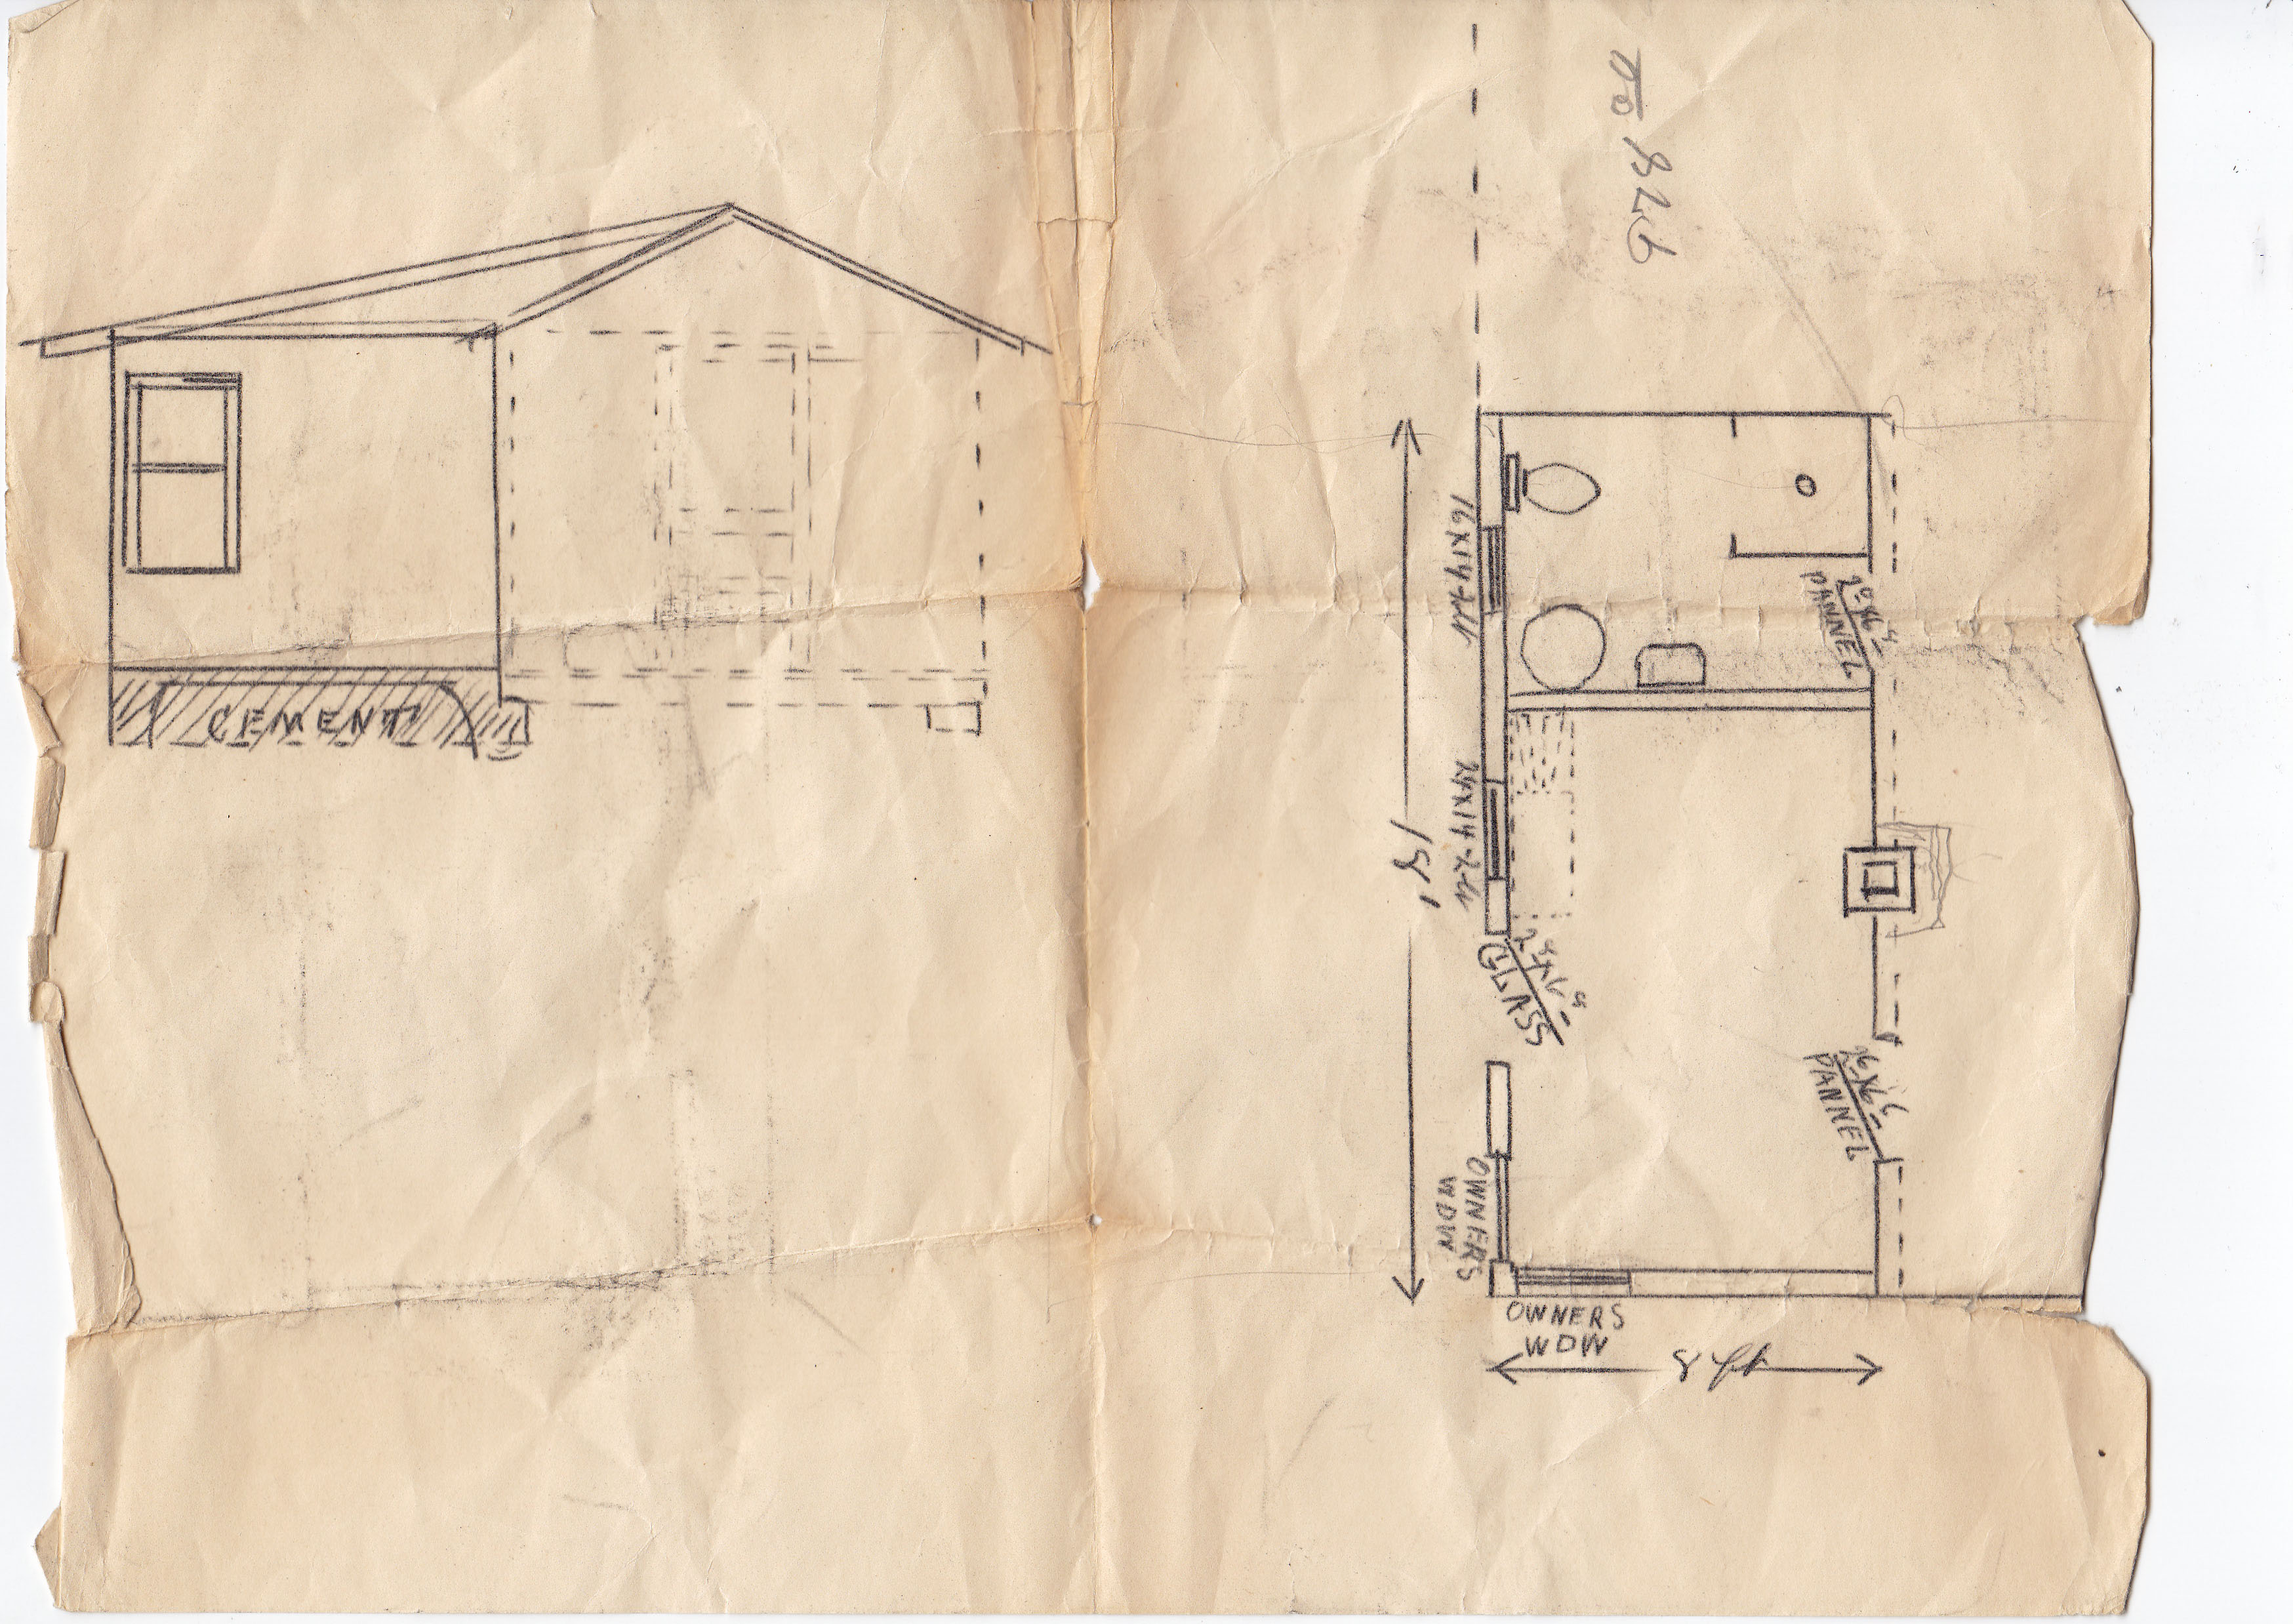
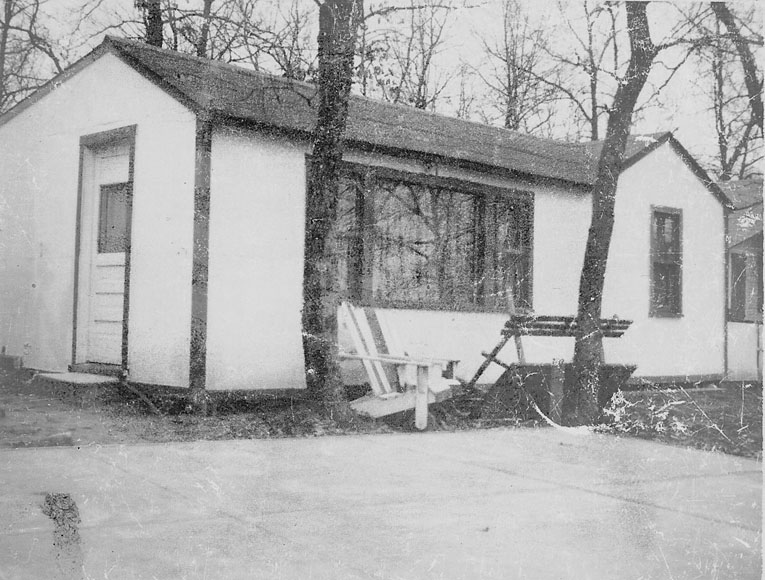
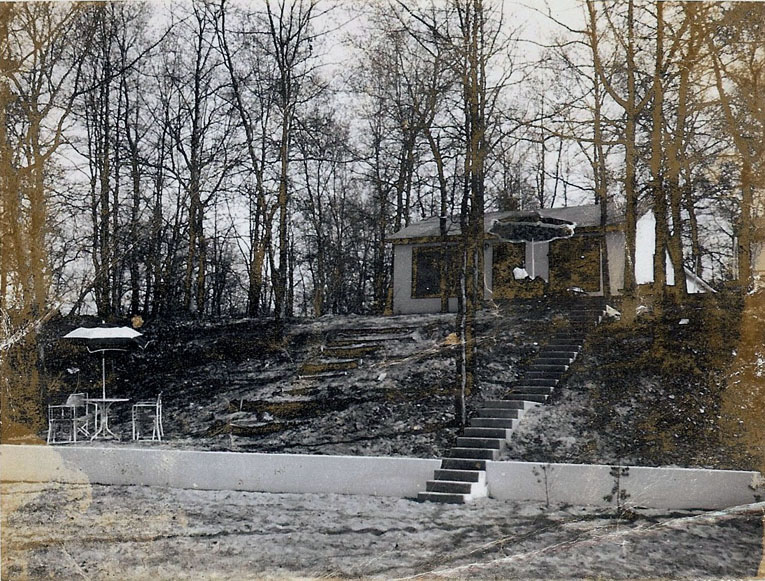
Starting work on the new cottage.Sketch on envelopeThe original cottage.The forms with the new patio. New cottage.Old stairs on the left. They were made of logs set in the sand. The new steps you can see on the right, all cement and even and smooth.
After watching Episode 3 of Many Rivers to Cross in which the Civil War; black soldiers, contraband; freedom; 40 acres and a mule; suffrage and loss of it; the all black town of Mount Bayou, MS; lynching and finally Plessey vs. Ferguson were discussed, it took me a minute to come up with a tie in to my own family history to write about.
I began to think about my 2X Great Grandfather Joe Turner of Lowndes County, Alabama and how important land was to him and how it caused a riff between him and his son, my Great Grandfather Howard Turner. Something we always wondered about was how Joe Turner ended up with land at the end of the Civil War. Someone suggested it must have been Homestead Land. There is no indication that it was. I am going to write about Joe and Emma (Jones) Turner and their land.
As I started organizing materials, I looked to see if I could find any new information. In Mildred Brewer Russell’s book, “Lowndes Court House” on page 127 she says “Prominent Negro politicians during the carpetbag regime were Joe Turner, Oliver Marast, Jasper Cottrell, James Jackson, Tom Cook, Hamp Shuford, Frank Streety, Adam Lundy, Sam Robinson, Jule Cottress, Jerry Cook, Billy Spann, Cyrus Miles, Johnson Rambo, Robert McCord, Hope Harris, John W. Jones, and the three Carson brothers, Hugh, Will and Warren.” I wanted to find a record, another book, something that validates that the Joe Turner mentioned in the book, was my 2X Great Grandfather, Joe Turner.
I had no luck with the politics, aside from his name on a list of registered voters, but within 24 hours I found 2 new documents on Ancestry.com – the 1866 Colored Population Census and an Agricultural Census form for Joe Turner for 1880. Online I found a copy of a court case involving a land case between my 2X great grandfather and his son, my great grandfather.
__________________________
When shots were fired on Fort Sumter and the Civil War began in 1861, Joe and Emma (Jones) Turner were enslaved in Lowndes County, Alabama. I found Joe on the plantation of Wiley Turner but have so far been unable to find Emma and their children.
When the war ended and they were enumerated in the 1866 colored population census, they had 3 children under 10 – my great grandfather Howard who was three years old, his sisters, two year old Fannie and four year old Lydia. Joe and Emma were 25.
In 1870 they were farming. There were two more children, three year old Joe and 10 month old Anna. Neither of the adults could read or write. None of the children were old enough for school. Their personal estate was worth $300.
In the 1880 State Agricultural Census they farmed 76 acres, which they rented for cash. Farm implements and equipment were worth $100. Their livestock was worth $460 and included 2 milch cows; 12 other cattle (seven purchased in 1879 and one that died.); 20 swine; 36 barnyard fowl, who produced 100 eggs in 1879; one horse and four mules. They grew 25 acres of Indian corn, yielding 300 bushels; 50 acres of cotton yielding 12 bales and one acre of sugar cane yielding 48 gallons.
In 1880 US Census 16 year old Howard was clerking in a store. Joe Jr. was 13 and in school. Their sister Fannie no longer appears in the census and perhaps she was married or she may have died. I haven’t found a death record for her, I know that she died young. Several of her brothers named their daughters for her. My grandmother Fannie Mae Turner, was named for her Aunt Fannie. But that is getting ahead of myself. Another son, seven year old Alonza Turner, had joined the family since 1870.
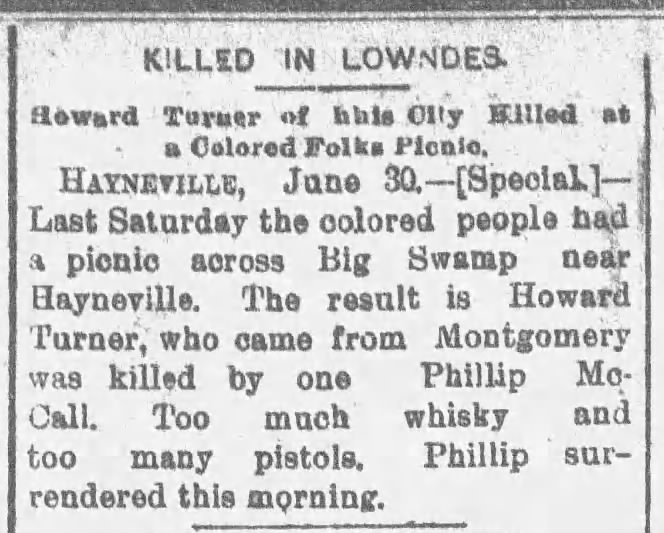
Howard Turner and Jennie Virginia Allen were married in June of 1887. My mother told me this story: Howard’s father, Joe Turner, gave them land to farm in Lowndes County, Alabama. Joe wanted the land to stay in the family forever. By 1890 Joe and Howard were arguing constantly about Howard and Jennie’s desire to sell the land and move to Montgomery. The day of the fateful barbecue, the arguments had been particularly violent. Jennie was in Montgomery visiting her parents with their two young daughters when word came that Howard had been shot dead at the barbecue.
According to the court record, Joe and Howard had agreed to purchase some land together. They both promised to pay an equal share. When it came time to pay, Howard refused and Joe paid all of it. In 1890, my 2X great grandfather, Joe took Howard to court to recover his money. During the trial, Howard died. His youngest child, Daisy, was not yet one year old. The Court case against Howard was revived against his heirs and the Court ordered Howard’s interest in the land sold to pay the lien Joe had gotten in the Chancery decree in 1897. In 1915 Daisy Turner brought a case before the Alabama Supreme Court to ask that she receive her inheritance from the sale of the land the original case concerned. By that time, 15 years had passed. Joe and Howard Turner were both dead. Joe’s second wife had moved to Montgomery with their children. Daisy lost her case. I think because her father hadn’t paid for his share of the land and so there was nothing to inherit. It seems that the land was sold after the first case. I will have to see if I can find the records of that case.
By 1900 Joe owned his own farm, although it was mortgaged. Emma could read and write, although Joe could not. She had given birth to 10 children. Only 3 were still living, Joe Jr., Alonzo and Lydia. Lydia’s two children, Anna Lisa and Joseph Davis, were enumerated with their grandparents.
Emma (Jones) Turner died around 1901. In 1902 Joe Turner, who was then 60 years old, married Luella Freeman who was 29 years old. He continued to farm and they had 9 children before he died at about age 80 in 1919. By 1930 Luella and most of her children were living in Montgomery. They ended up in Chicago, Illinois.I hope the land went to one of the older boys but I don’t think so.
My cousin Marilyn recently sent me copies of some photographs and family documents. Tucked into the envelope was this poem. She asked me to share it, and even though modesty made me hesitate to publish it, here it is.
My Cousin Kris
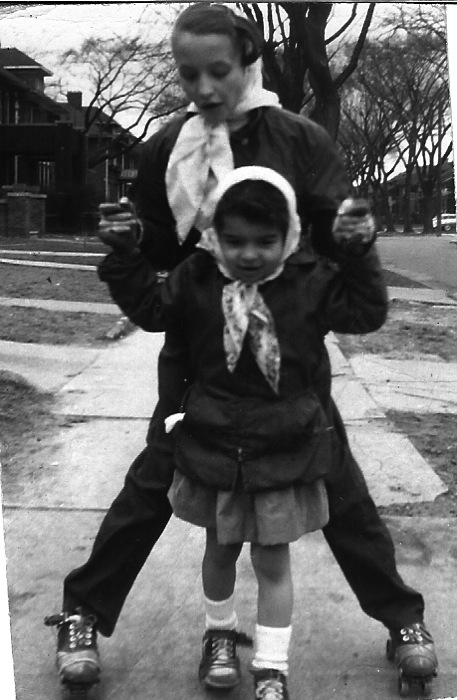
I’m helping Marilyn roller skate. About 1958 on Calvert in Detroit.
She keeps all the pictures,
And copies all the stuff.
And after all that creative work,
That still is not enough.
She sends copies to the family
And searches for the lost.
All out of her pocket,
Never asking for a cost
She loves the work she’s doing,
And is very computerized.
She’ll create a family tree
And come up with great surprises.
Always helping family,
Raising all her own
Productive, wonderful children,
From the seeds that she has sown.
Another generation
Has come into her life
Beautiful, smart grandbabies
The daughters, now a wife.
She has a laugh that makes me smile
And we remember olden days.
A cousin I can talk to
With great listening ways.
My cousin Kris, so smart
To go with a special soul
A mind forever thinking
And a warm heart of gold.
Cuz, keep doing what you’re doing
Be blessed in all your days
Know you’re appreciated
In oh, so many ways!
While watching “Many Rivers to Cross” this week, an episode full of stories of resistance, escape and fighting back, this is the family story that came to mind.
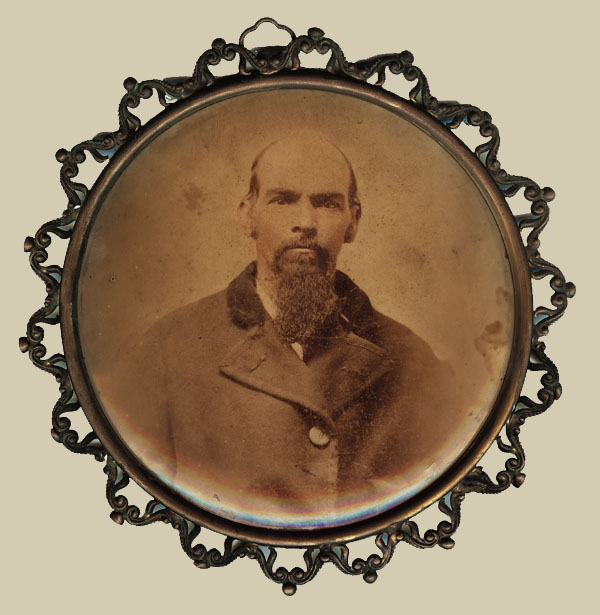
Dock Allen – tintype with frame attached.
It had been a wet spring, that 1861 in Dallas County, Alabama. Dock Allen was 21 years old and already a good carpenter. He was a white man’s son, but the man who now held him in slavery was not his father. His owner was known as a cruel man who kept vicious dogs to instill fear in his slaves. He wanted them to be afraid to run. When Dock made up his mind to escape, he had a plan to throw the dogs off of his track. There was a swampy area where wild ramps grew. He rubbed himself with them, poured the water on himself and rolled around in the field so the strong onion odor would hide his own human smell.
He had been running and running. He was bone tired. He could hear the dogs tracking him in the distance when he came to a small farm near Carlowville. He couldn’t go any further. He climbed up into the hay loft, covered himself with hay and lay there barely breathing. The dogs came into the hay room. He could feel their breath as they walked over him, but they didn’t smell him because of the ramps. Eventually they left.
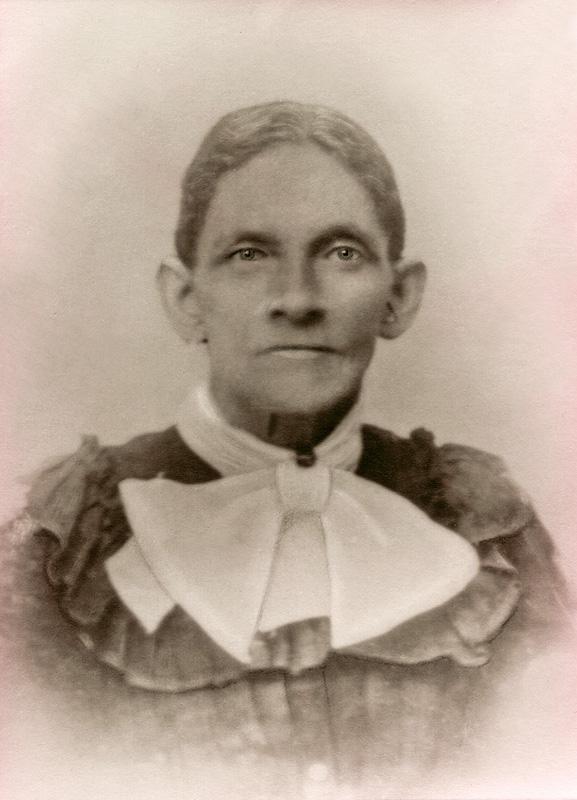
Eliza
This was the same place where Eliza and her small daughter Mary, lived. Eliza had been freed several years before. She lived on the farm of Nancy Morgan. Did Eliza hear the dogs and see Dock stumble into the yard? Did she silently direct him to the hide in the hay?
Later Dock decided to give himself up. Nancy sent a message to his master. It wasn’t long before he came to the house. He said that no one had ever out smarted his dogs and that any man who was smart enough to do that deserved to be free and he freed Dock. Dock stayed on that place and he and Eliza married. They stayed together until he died in 1909. He was 69.
Doc Allen in the record.
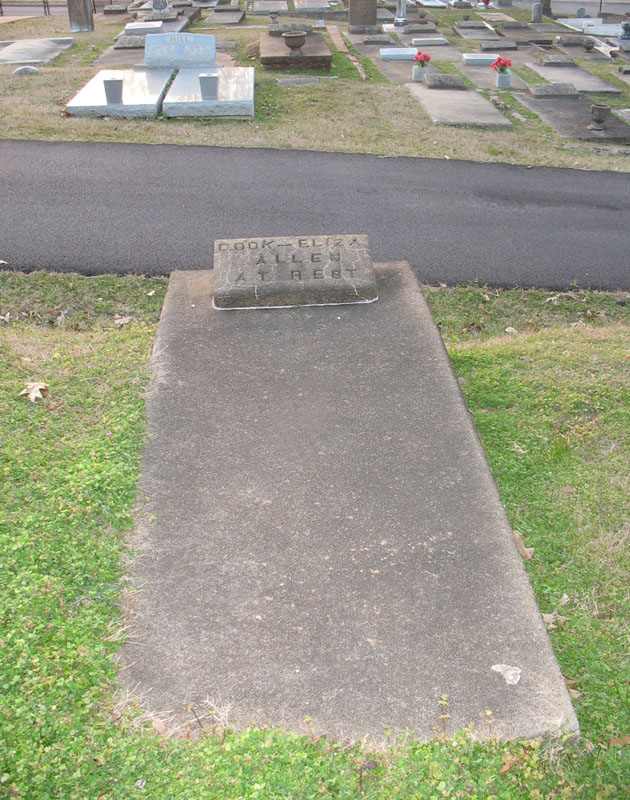
Dock and Eliza (Williams) Allen’s grave.
I found Dock Allen in in the 1867 voter registration database living in Montgomery, AL. He appears with his family in the 1870, 1880 and 1900 census in Montgomery. According to the records he was a carpenter born in Georgia. He owned his own home. In the 1900 census he and Eliza had been married 40 years which puts the beginning around 1860.
I have three addresses for him, 237 Clay street, 216 Holt street and finally 444 S. Ripley street where he lived for the five years before he died March 29, 1909 of “inflammatory bowels” after being ill for several weeks. His mother is named as Matilda Brewster on his death certificate. No father is listed. He is buried in Oakwood Cemetery in Montgomery.
I don’t know if this is exactly how Dock Allan escaped from slavery. This is the oral history that we have. I never knew this story until my cousin Jacqui Vincent and I made contact years ago. Dock and Eliza (Williams) Allen were my 2X Great grandparents. I’ve written more about Eliza’s story in these posts.
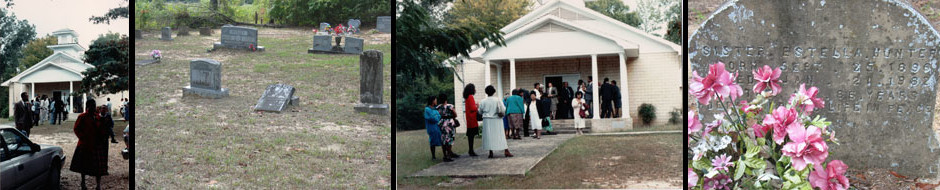
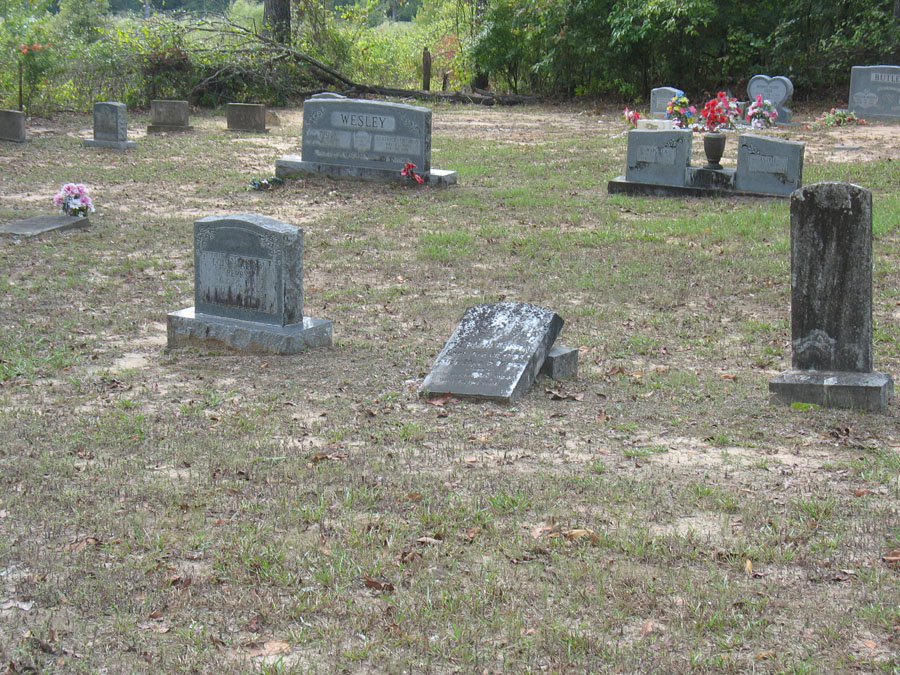
Photograph by James Edward Williams – a corner of the Harmony Missionary Baptist Church Community Cemetery.
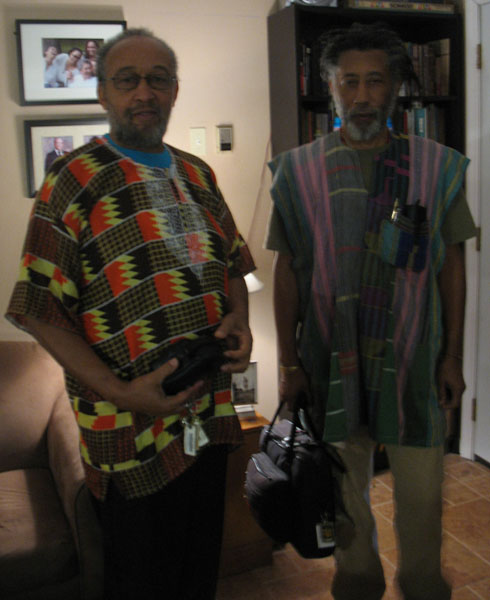
James Edward & Samuel Williams – cousins with cameras.
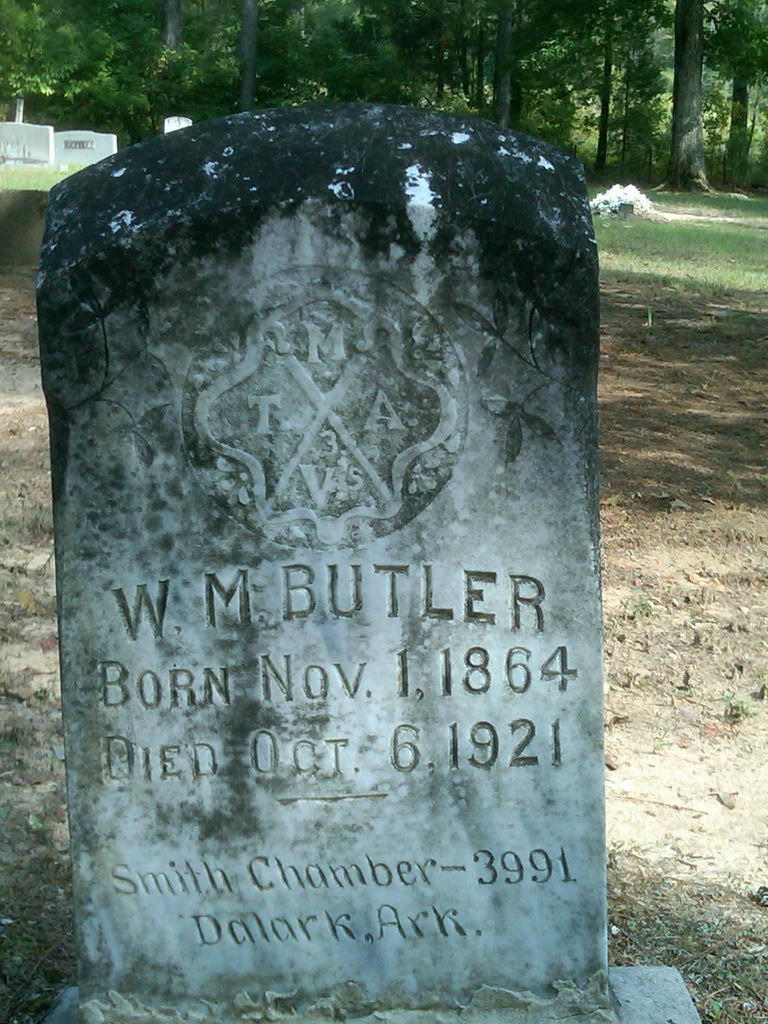
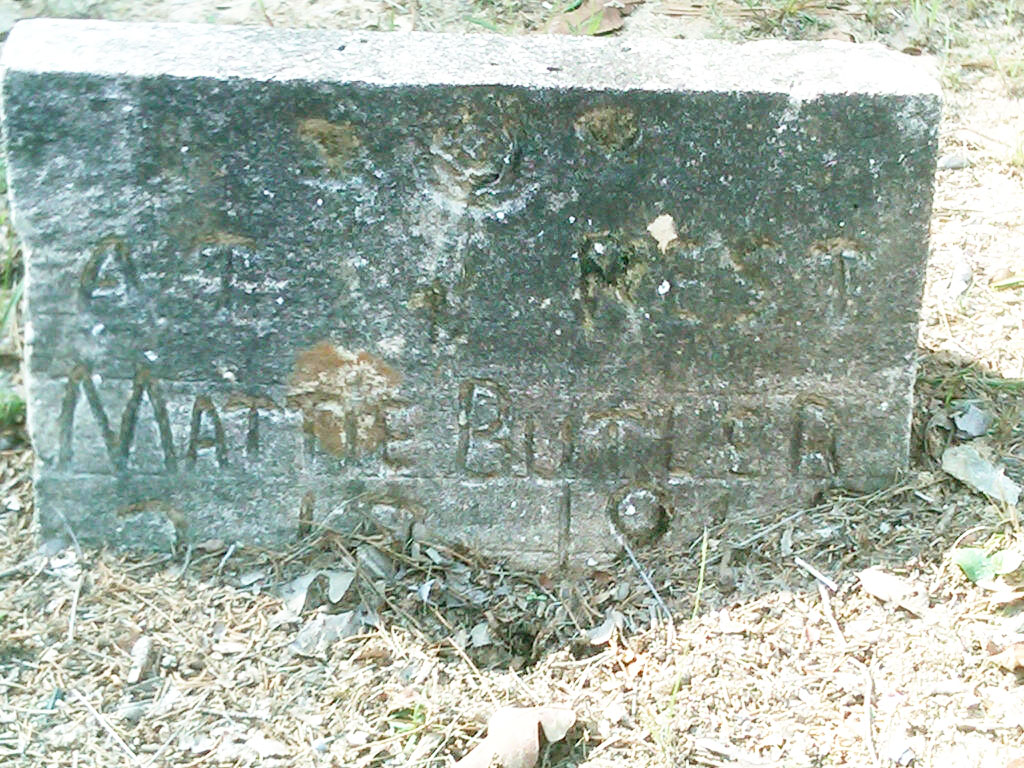
My husband and his cousin recently attended an extended Williams/Butler family reunion in Arkansas. This reunion has been going on for 43 years, although not every year has seen a reunion, most have. While there they photographed some of the grave stones in the Harmony Missionary Baptist Church Community Cemetery in Sparkman, AK. The two headstones featured in today’s post are of my husband’s great grandparents. William and Mattie (Hawkins) Butler were the parents of 13 children that lived to adulthood. One of those was my father-in-law’s mother, Annie Willie Butler. Today I am sharing the grave stones. Soon I will be posting what I have learned in the records about the Butlers and their family.
W.M. Butler Photo by Samuel Williams. October, 2013. What does the sign at the top stand for? And the words at the bottom?
“At Peace – Mattie Butler” Photo by Samuel Williams. October, 2013. I only wish I could see the dates at the bottom because I don’t have them!
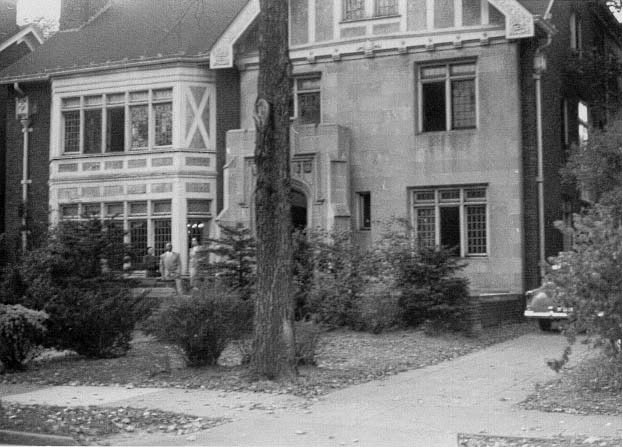
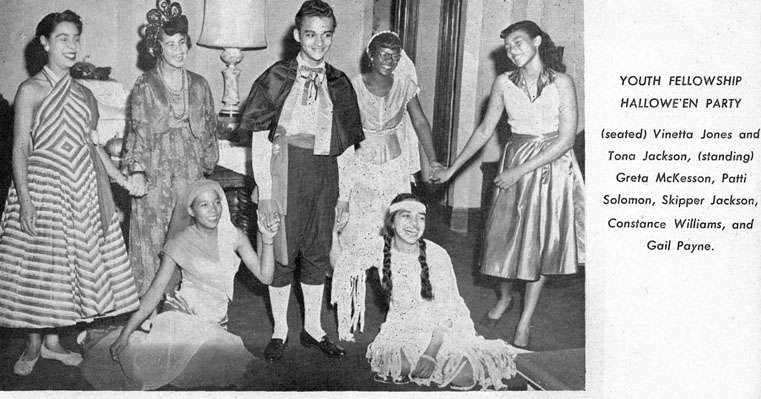
I don’t remember hearing memories of childhood Halloween celebrations from my parents. I do have a few memories of my own. When I was about 7 years old and we lived in the parsonage at 2254 Chicago Blvd in Detroit, the Youth Fellowship met in the basement. They were having a Halloween party. I remember my sister and I watching them come in all dressed in various costumes. I don’t know if it was the same year as this photograph was taken or not.
From the 1956 Youth Fellowship Yearbook
That same year we dressed up and went over to our cousin’s house to help distribute candy to the trick-or-treaters. I remember wearing my Aunt Mary Vee’s skirt and dressing as a Gypsy. We never were allowed to go trick-or-treating, but enjoyed passing out the candy. When we were highschool age, we would sometimes leave town for the day to avoid the whole holiday and passing out candy by not being home. I have no pictures of us in any Halloween costumes.
When my own children were old enough to know Halloween was happening, we did not live in the city. I remember my very young daughter’s going with the older neighbors up and down our short block trick-or-treating in Mt. Pleasant, SC. It was unseasonably cold and they had to wear winter coats over their homemade costumes.
We moved to Mississippi the next week, where we lived out in the country and there wasn’t any trick-or-treating, instead there would be an evening carnival at the school. The students would dress up and there would be booths with games and treats. In Excelsior Springs, MO I don’t remember my kids going trick-or-treating but two had paper routes and their customers gave them so much candy! Way, way more than anyone needed in a year.
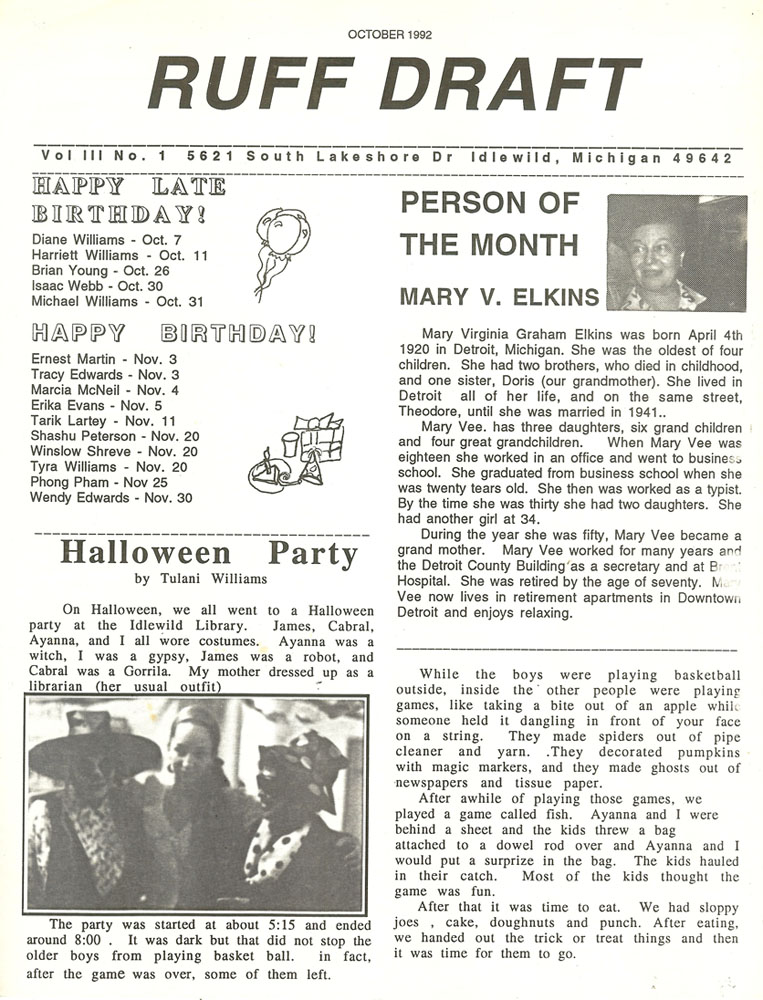
The next move was to Idlewild, MI, in the middle of the Manistee National Forest. Some years there was a school carnival. Other years the kids went to town and trick or treated the 2 block business area. A couple of years my Aunt Gladys and Henry had a get together with cider and doughnuts for Halloween. The year when I was librarian at the Yates Township library we had a community party with bobbing for apples, a fishing booth and refreshments. Here is an article about it from the Ruff Draft, our family newsletter.
My father considered putting on plays a good project for the church youth groups. I remember one about a rummage sale that was put on in the basement of the parsonage on Chicago Blvd in the 1950s. Unfortunately, I can’t find any photographs. I remember a play he tried to put on with the Youth Fellowship in the 1960s where the actors just couldn’t get into the spirit of the play and it was canceled. Again, no photos.
My mother took acting classes at the local YWCA when she was a child and told me she learned how to fall down dramatically without hurting herself and that and her friend used to try and shock people sometimes when they were walking down the street by falling out. No photos.
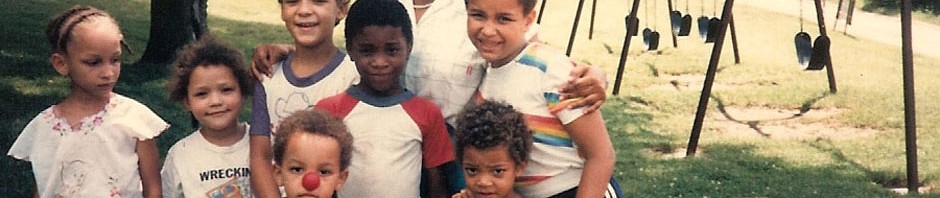
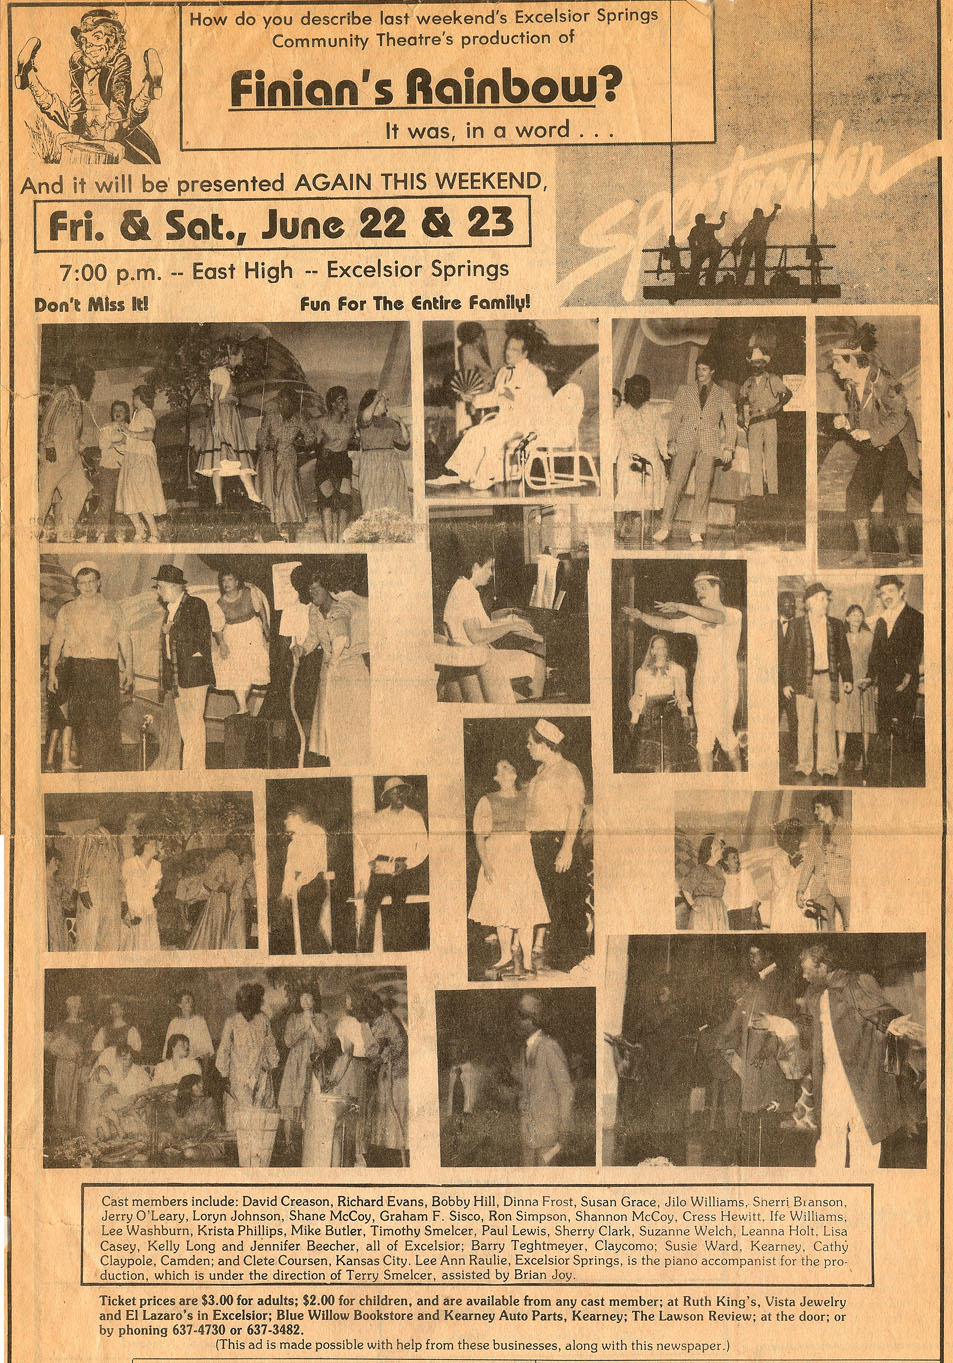
But, when we lived in Excelsior Springs, MO in 1983 – 1985, my oldest daughters participated in several of the plays put on by the Community Theater. I remember Finian’s Rainbow and Peter Pan. There were lots of rehearsals in the evening and that we lived close enough to the practice place that they could walk downtown and back. This was good because we only had one car and it was often with my husband. We all missed the theater when we moved.
Jilo was in the production Excelsior Springs 1984 production of “Finian’s Rainbow”.
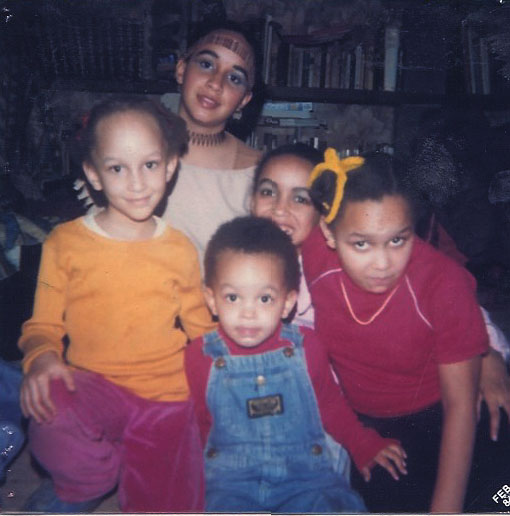
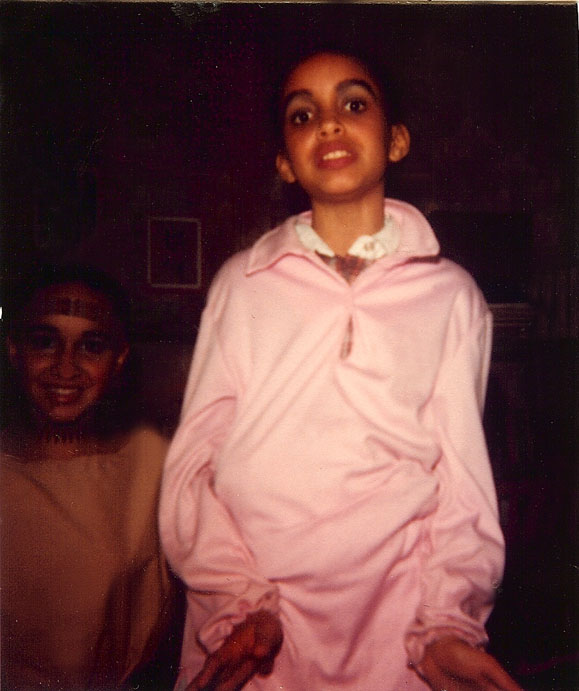
Jilo as Princess Tiger Lilly and Ife as a lost boy, in costume. The other’s are just in the photo.
Jilo and Ife ready for “Peter Pan.” Excelsior Springs 1984.
 This post was written for the 5th and newly reborn Carnival of African American Genealogy (CoAAG), hosted by Luckie Daniels of Our Georgia Roots and Our Alabama Roots and founder of the facebook community African-American Genealogy & Slave Ancestry Research (AAGSAR).
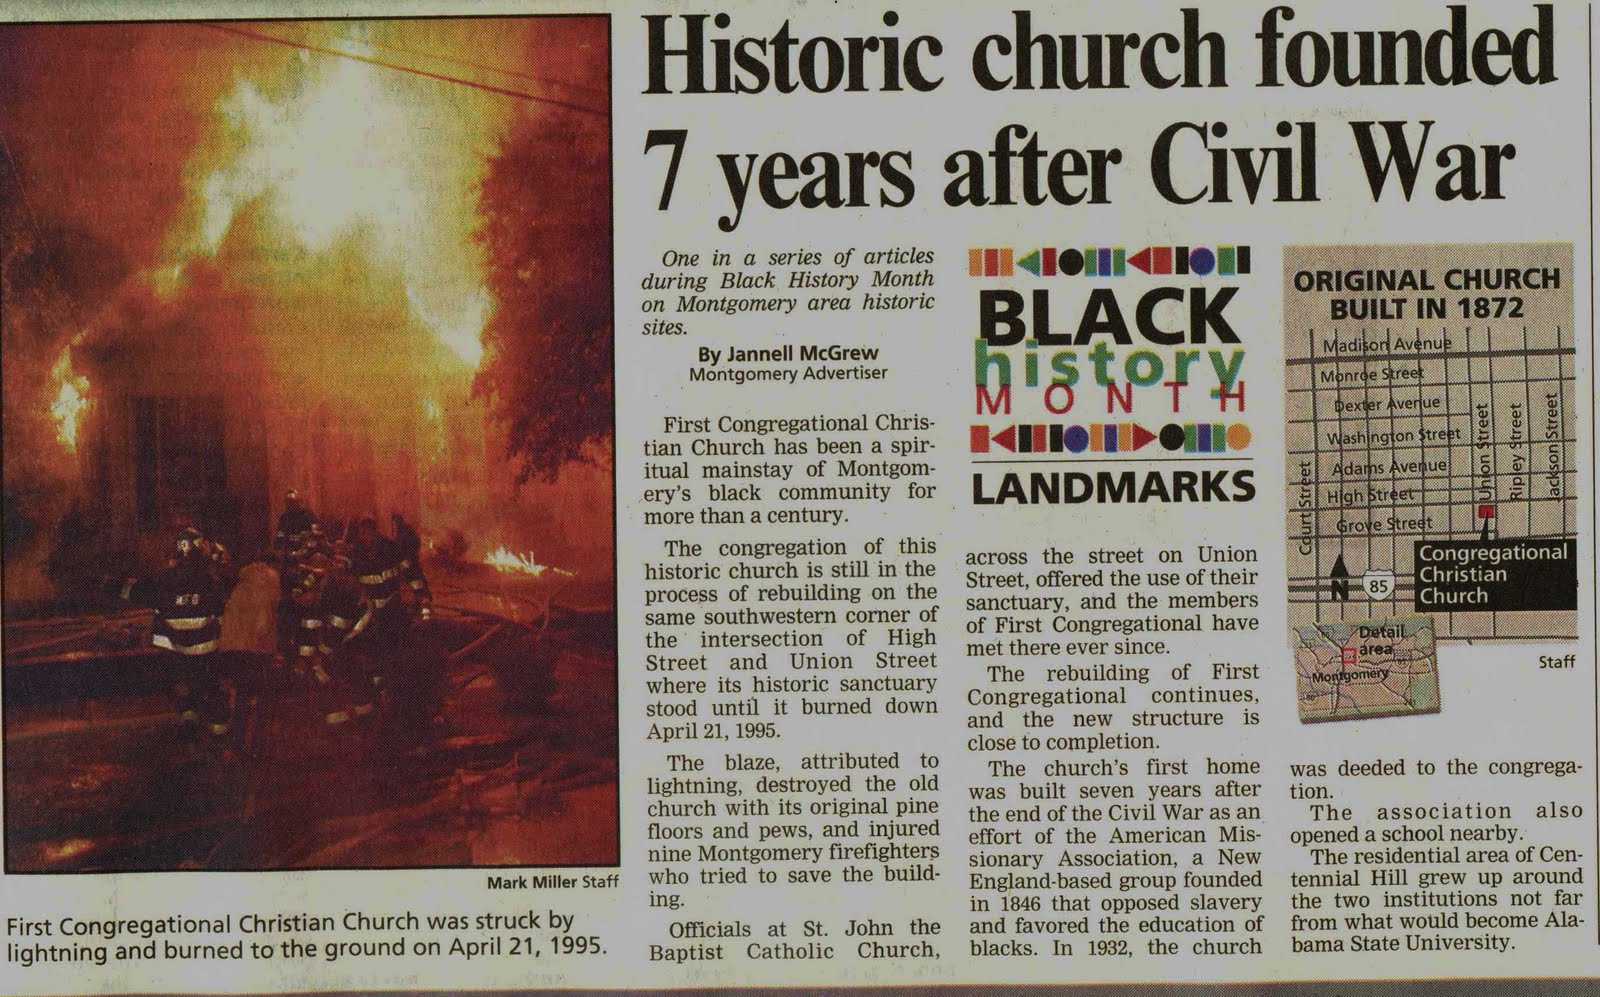 My grandparents, Mershell and Fannie (Turner) Graham met in the First Congregational Christian Church in Montgomery, Alabama. They were married there by Rev. Scott on June 14, 1919. After the ceremony, Mershell took his new bride back to Detroit to begin their new life. One thing that would be familiar was the worship service at the newly formed Plymouth Congregational Church.